
This article has been updated to reflect the enhancements that will be available after Friday 30 January as part of the January 2026 Release.
Available as a feature in the new marking tool, you can gain insight as an assessor or reviewer into the distribution of responses to each (options-based) question on a flow and scoring statistics for both auto-scored and manually scored questions. This can be from a cohort-level perspective (statistics on all participants to which you are allocated) and on a submission-level (comparison of an individual submission with the rest of the cohort). By using the available statistics you can spot common distribution patterns and question difficulty, that will help guide your marking.
WISEflow generates the statistics dataset when the marking period of the flow starts. The dataset is rebuilt when certain changes occur on the flow:
- Additional participant submissions are made
- Participant submissions are withdrawn
- Rescoring of items (which may also include changes to responses validation)
- Enabling/disabling of participants
- Changes to assessor or reviewer allocations to participants
- Modifications to the Item-based Marking matrix
In this article:
- Response Statistics
- Scoring Statistics
Response Statistics
Viewing response statistics at the submission level
When accessing the marking tool as either an allocated assessor or reviewer, the Question statistics button can be found near the top-right of the screen.
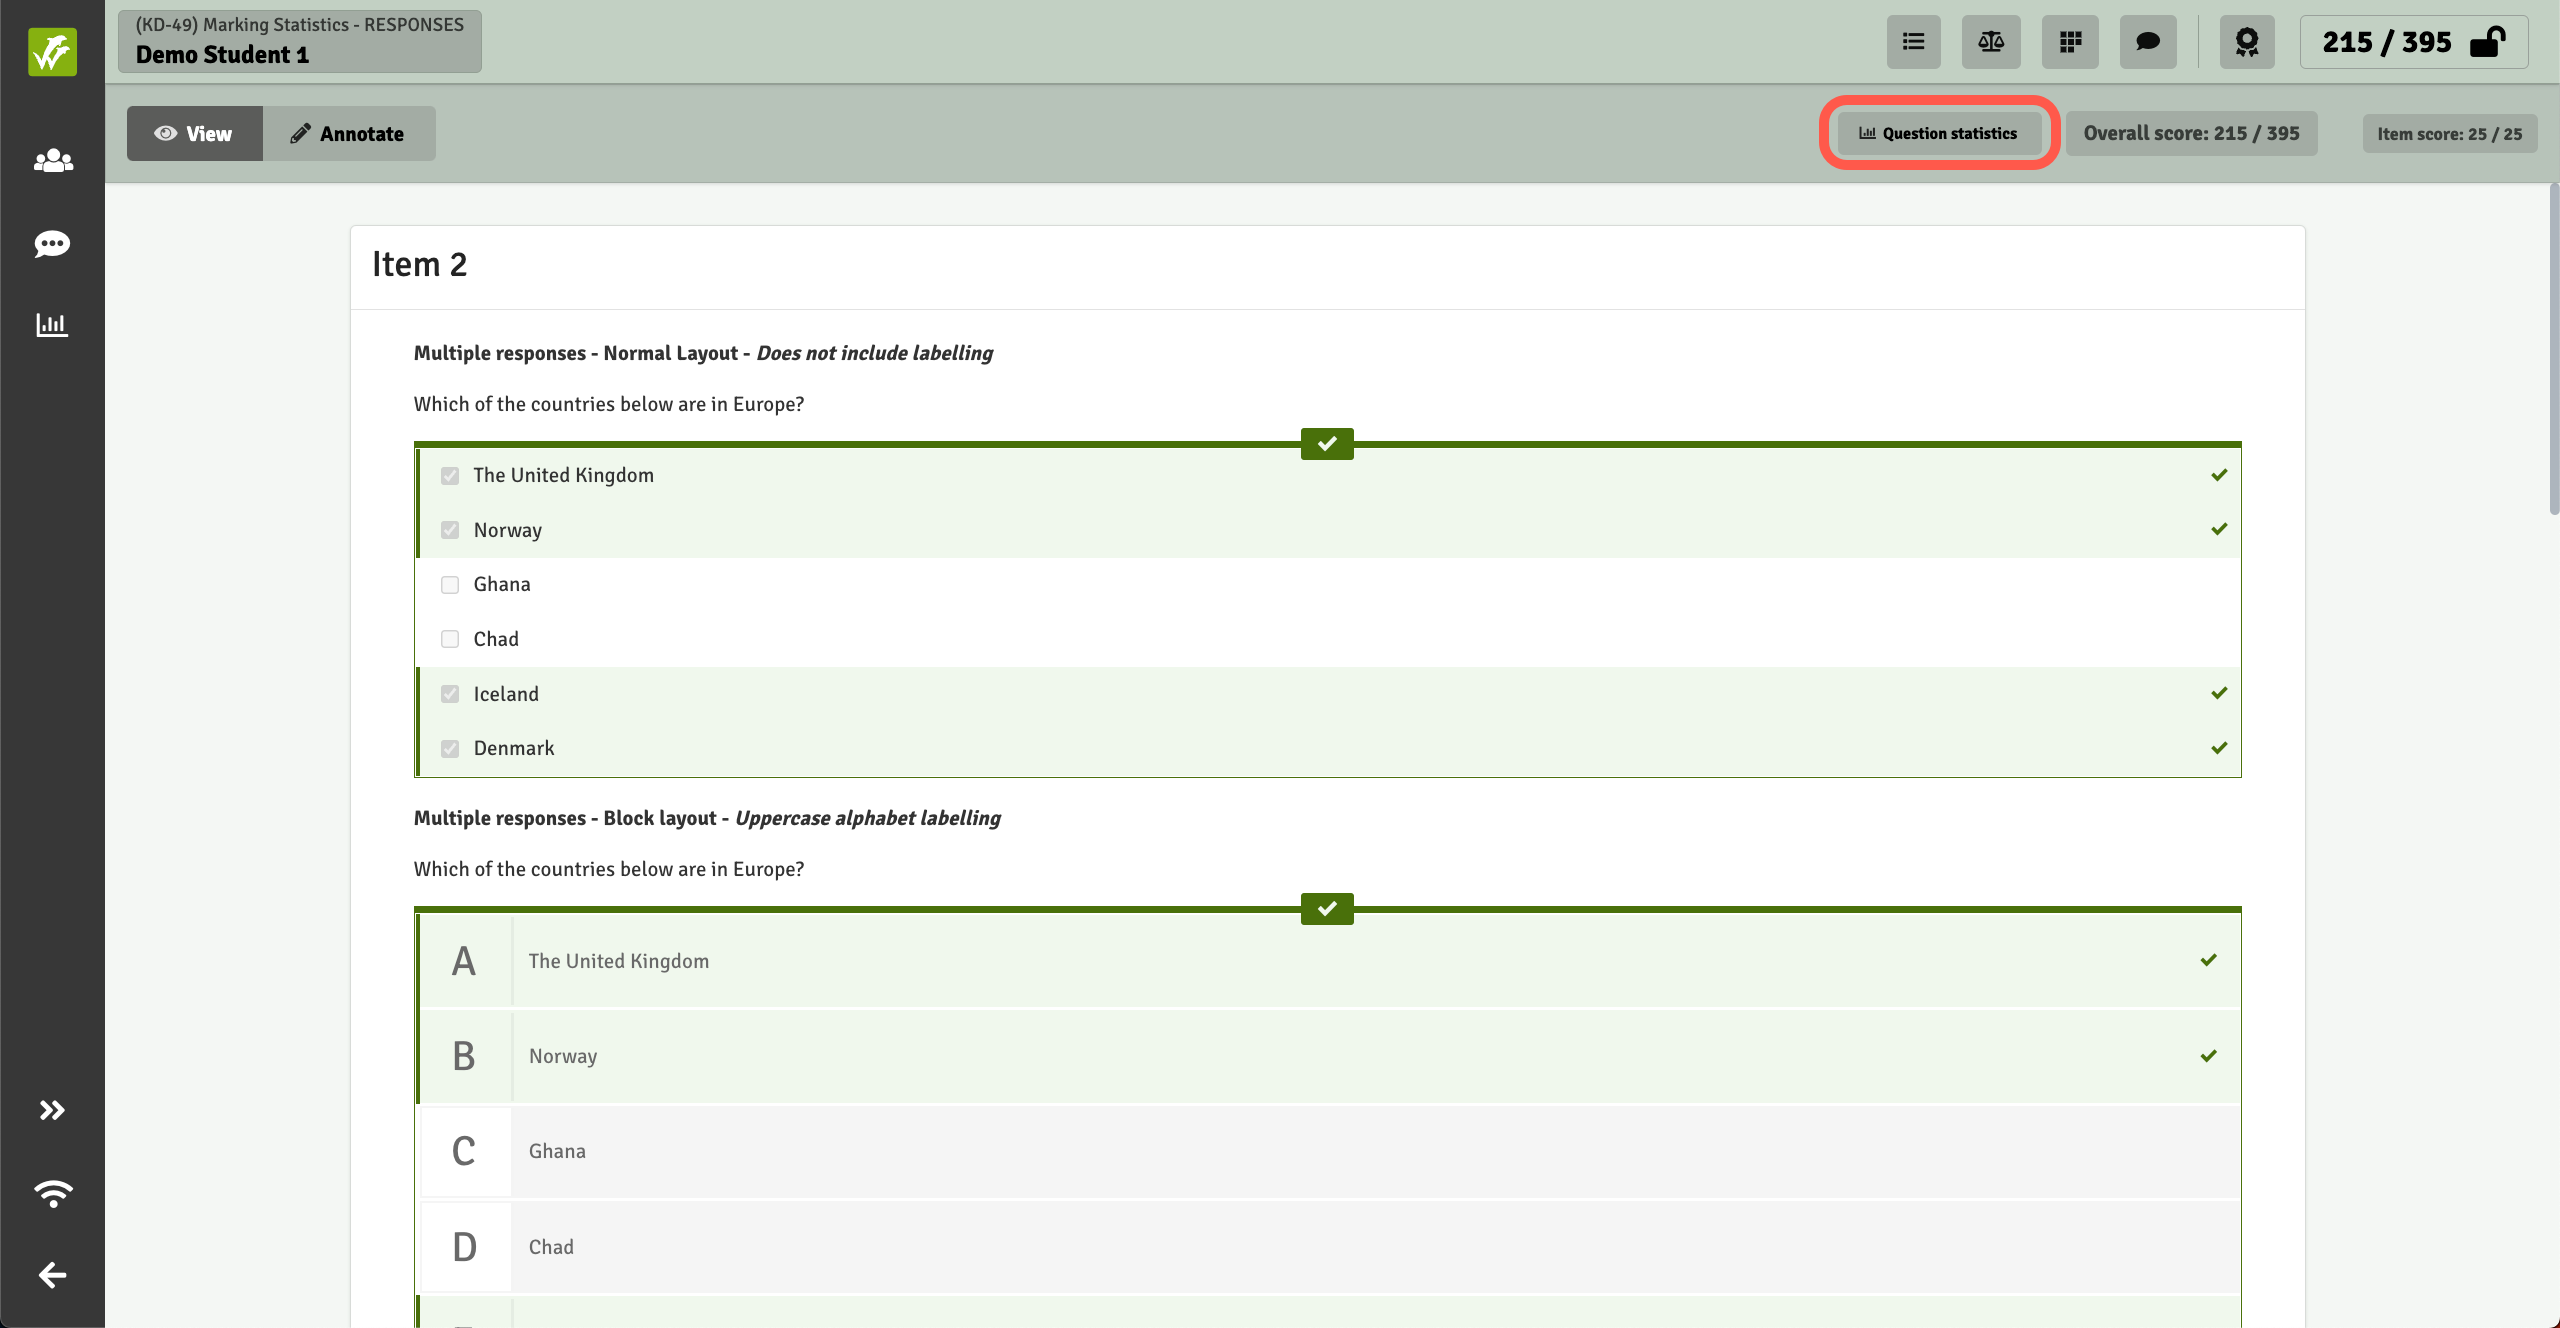
The Question statistics window will display question responses and scoring statistics for the item currently being viewed within the marking tool.
In the example below, the correct answer is responses 1+2+5+6 (Multiple Response question), which two participants gave as their response. One participant selected the responses 3+4.
By enabling the Show current submission toggle, a black outline highlights the response that the current participant (the participant whose submission is currently being viewed within the marking tool) provided for the question.
Hovering on a response block in the statistics graphs displays a tooltip which details the response and the number of participants that selected that response.
By clicking on Detailed view, the window expands to display the authored item including response validation of the correct answer(s), if auto-scored.
When an assessor is allocated to specific items via item-based marking, statistics will only be shown for the items to which the assessor has been allocated.
Viewing response statistics at the flow (allocation) level
Flow statistics can be opened by clicking on the Flow statistics button on the left-hand navigation menu within the marking tool.

The flow statistics page shows all items for an assessor unless they have been allocated to specific items for a flow using Item-based Marking.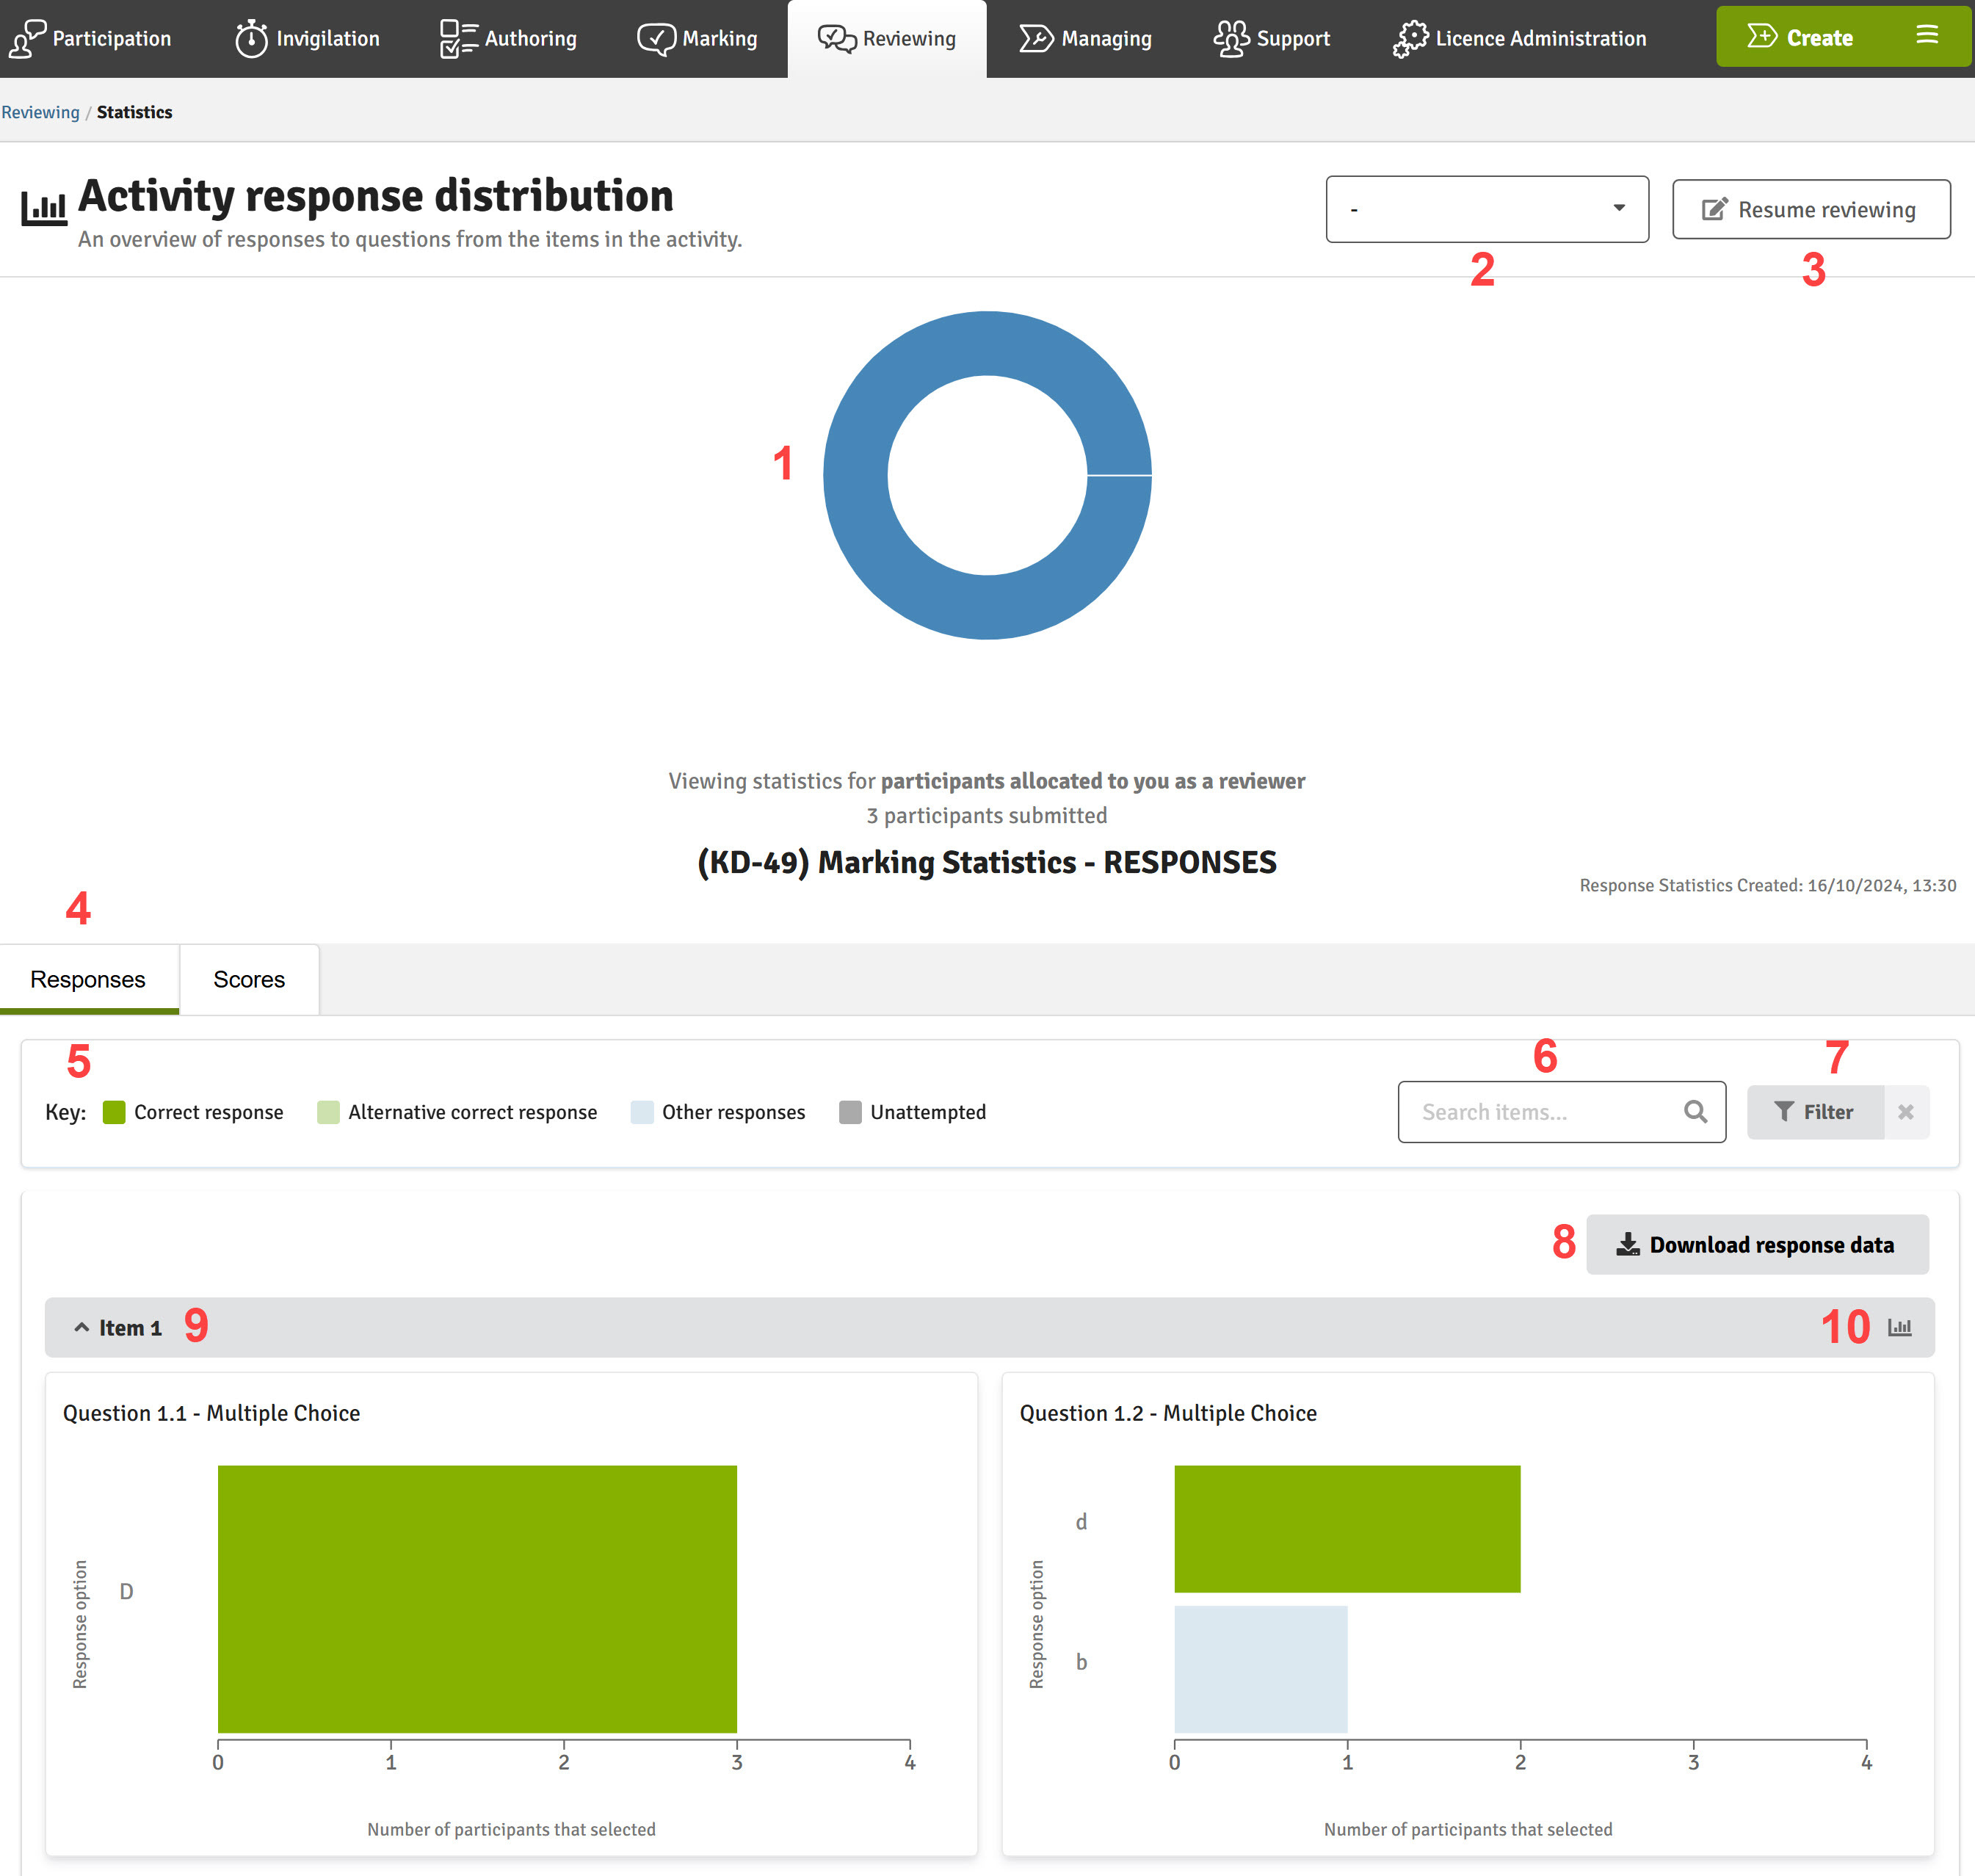
- Doughnut chart: The doughnut chart displays how many participants:
- have submitted (this number is that the statistics displayed are based upon)
- have not submitted
- have submitted blank
- Select assessor drop down (Reviewer only): If a reviewer has both the Allocated to all and View marking information privileges, they can access a drop-down menu allowing them to select specific assessors and view the response statistics for that assessor's participant allocation alone. If an assessor is selected from the drop down, the doughnut chart displayed changes to represent the information for the selected assessors participant allocation. Without selecting a specific assessor from the drop down menu, the reviewer is viewing response statistics for the entire flow cohort.
Without the relevant privileges described above, reviewers can only view response statistics for the participants to which they are allocated.
For assessors, this drop-down menu is not available. An assessor can only view response statistics for the participants to which they are allocated. - 'Resume' button: Clicking the Resume marking button takes assessors back into the marking tool at the point that they last visited. Reviewers see a Resume reviewing button which performs the same function.
- Responses: Access the statistics information related to participant responses.
- Key: Indicates the colours used within the response statistics graphs to represent:
- Correct response
- Alternative correct response
- Other responses
- Un-attempted
- Search: Search for item by title/number
- Filter: Filter the list by item number or question number.
- Download Response Data: Download the data for all responses per participant into an Excel file or an aggregated version per question.
- Item: Expands/collapses an item in the list. Expanded items enable the viewing of question level response statistics graphs.
- Item (detailed view): Displays the detailed view including the full question and the response validation of the correct answer(s), (if auto-scored).
Scoring Statistics
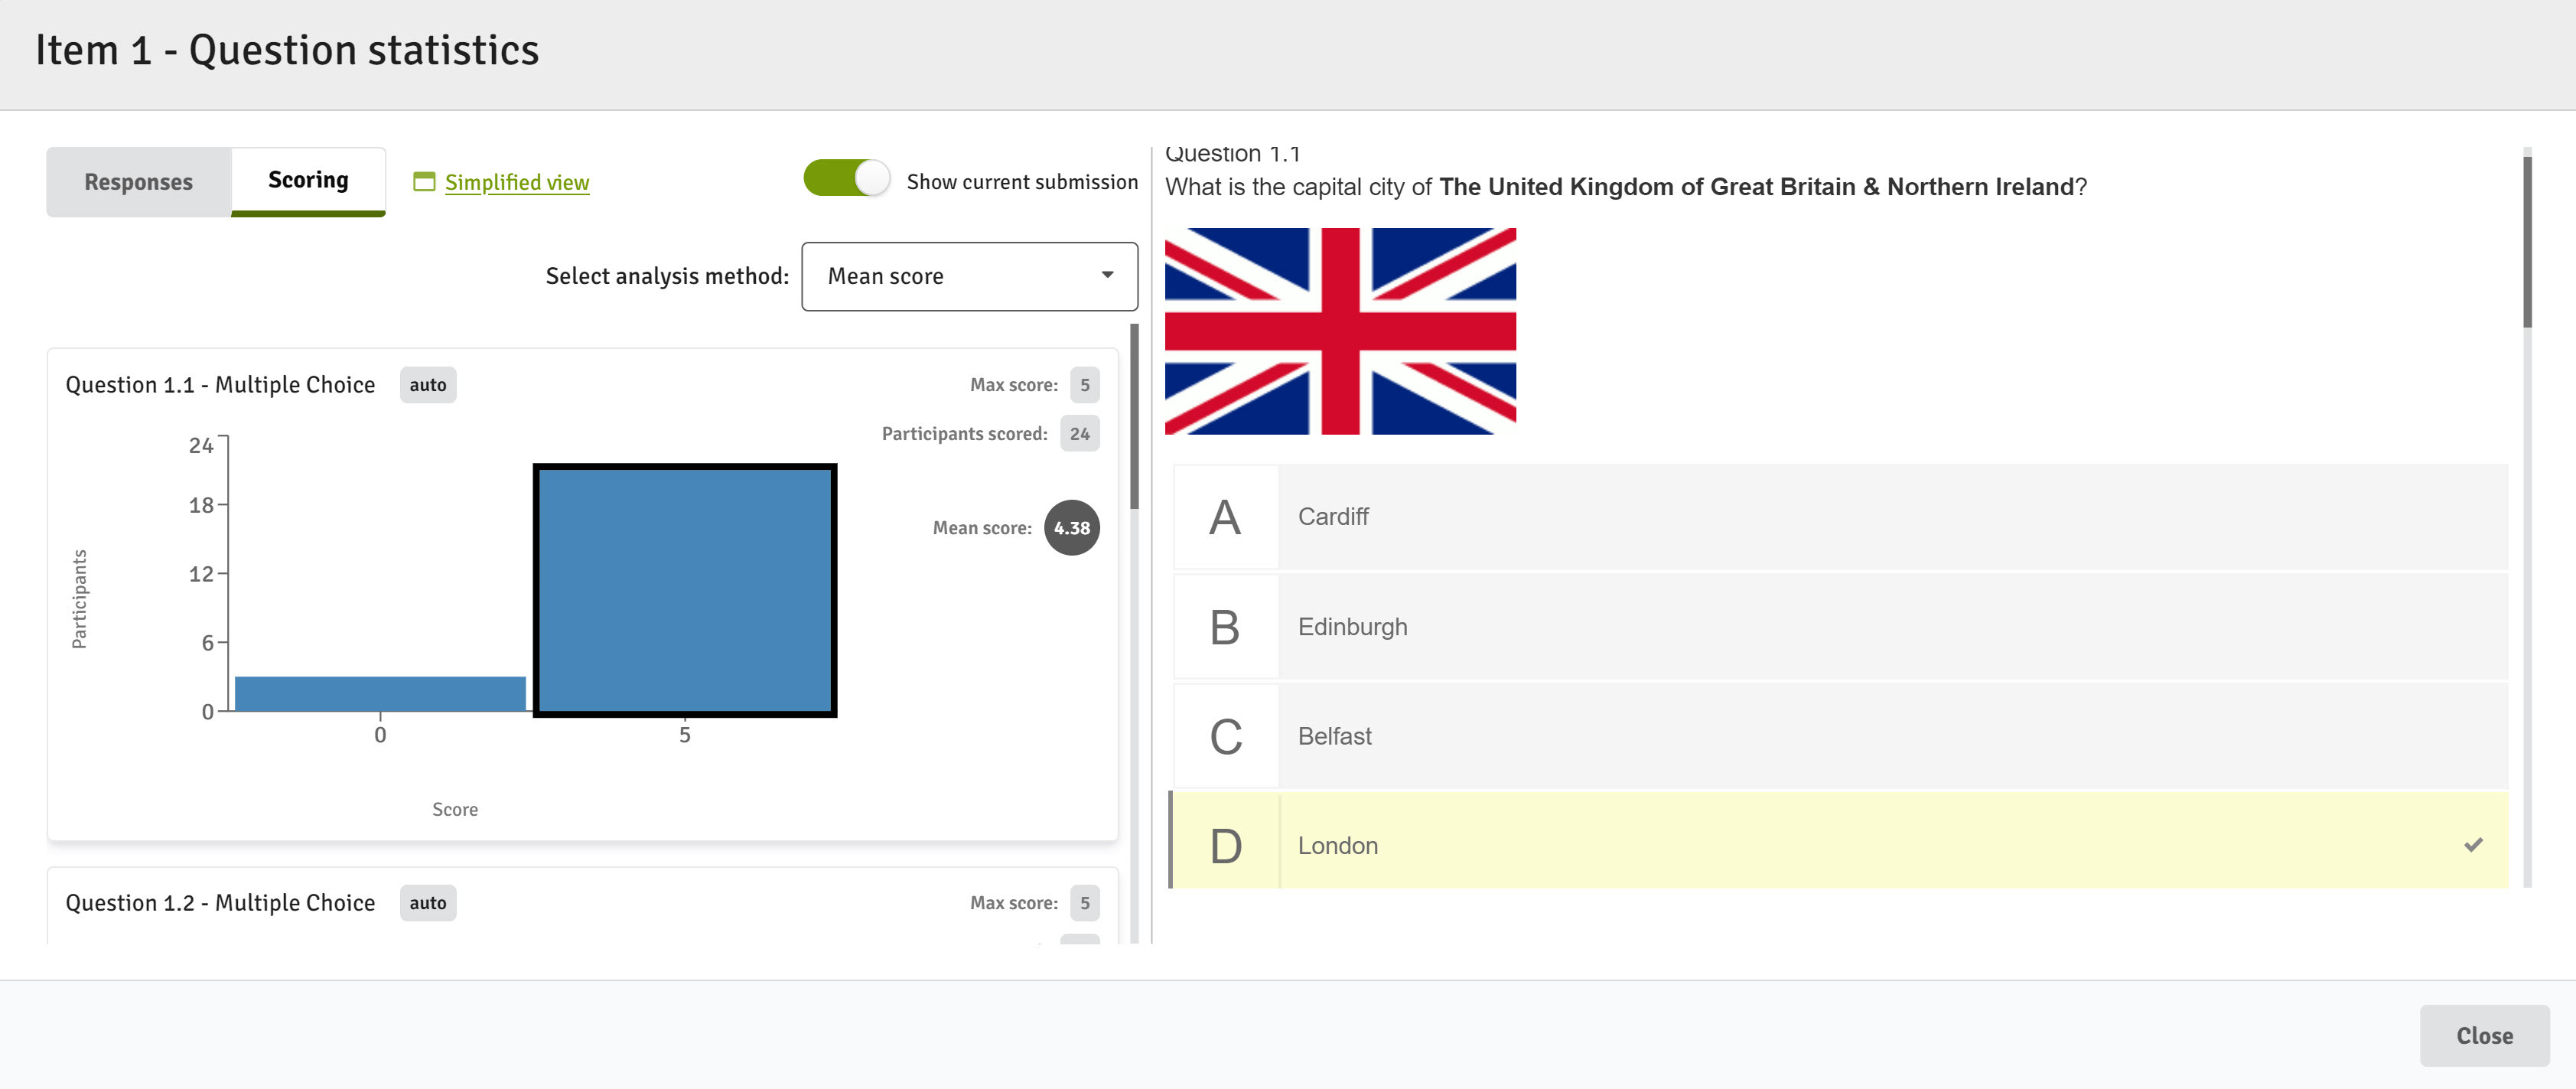
The Question statistics window will display question responses and scoring statistics for the item currently being viewed within the marking tool.
In the example below, 24 students in total have been scored on question 1.1 (auto-scored) for which a maximum of 5 marks is available.
A drop-down list enables the selection of an additional score or index to be displayed:
- Median score (the middle value/score from participants who have attempted the question)
- Mean score (the average score achieved from participants who have attempted the question)
- Difficulty index (Range 0.00 to 1.00 - the higher the index, the easier participants found the question)
- Discrimination index (to what extent the question favours/discriminates towards the participants with the highest scores. Range 0.00 to 1.00 - the higher the index, the greater the discrimination)
- Standard deviation (a measure of how dispersed the data is in relation to the mean)
By enabling the Show current submission toggle, a black outline highlights the score that the current participant (the participant whose submission is currently being viewed within the marking tool) provided for the question.
Hovering on a score block in the statistics graphs displays a tooltip which details the score and the number of participants that achieved that score.

By clicking on Detailed view, the window expands to display the authored item including response validation of the correct answer(s), if auto-scored.
When an assessor is allocated to specific items via item-based marking, statistics will only be shown for the items to which the assessor has been allocated.
Viewing scoring statistics at the flow (allocation) level
Flow statistics can be opened by clicking on the Flow statistics button on the left-hand navigation menu within the marking tool.

The flow statistics page shows all items for an assessor unless they have been allocated to specific items for a flow using Item-based Marking.
Click/tap for a larger view

- Doughnut chart: The doughnut chart displays how many participants:
- have submitted (this number is that the statistics displayed are based upon)
- have not submitted
- have submitted blank
- Select assessor drop down (Reviewer only): If a reviewer has both the Allocated to all and View marking information privileges, they can access a drop-down menu allowing them to select specific assessors and view the scoring statistics for that assessor's participant allocation alone. If an assessor is selected from the drop down, the doughnut chart displayed changes to represent the information for the selected assessors participant allocation. Without selecting a specific assessor from the drop down menu, the reviewer is viewing scoring statistics for the entire flow cohort.
Without the relevant privileges described above, reviewers can only view scoring statistics for the participants to which they are allocated.
For assessors, this drop-down menu is not available. An assessor can only view scoring statistics for the participants to which they are allocated. - 'Resume' button: Clicking the Resume reviewing button takes reviewers back into the marking tool at the point that they last visited. Assessors see a Resume marking button which performs the same function.
- Scores: Access the statistics information related to participant scores.
- Select analysis method: select an additional score or index to be displayed
-
- Median score (the middle value/score from participants who have attempted the question)
- Mean score (the average score achieved from participants who have attempted the question)
- Difficulty index (Range 0.00 to 1.00 - the higher the index, the easier participants found the question)
- Discrimination index (to what extent the question favours/discriminates towards the participants with the highest scores. Range -1.00 to 1.00 - the higher the index, the greater the discrimination)
- Standard deviation (a measure of how dispersed the data is in relation to the mean)
-
- Search: Search for item by title/number
- Filter: Filter the list by item number or question number.
- Download scoring data: Available in .xlsx or .csv format, data is available per question per participant or as aggregated data detailing, amongst other things, the median, mean, difficulty index, discrimination index and standard deviation of each question.
- Item: Expands/collapses an item in the list. Expanded items enable the viewing of question level response statistics graphs.
- Item (detailed view): Displays the detailed view including the full question and the response validation of the correct answer(s), (if auto-scored).